Ethereum Approaches Critical Resistance at $2,400
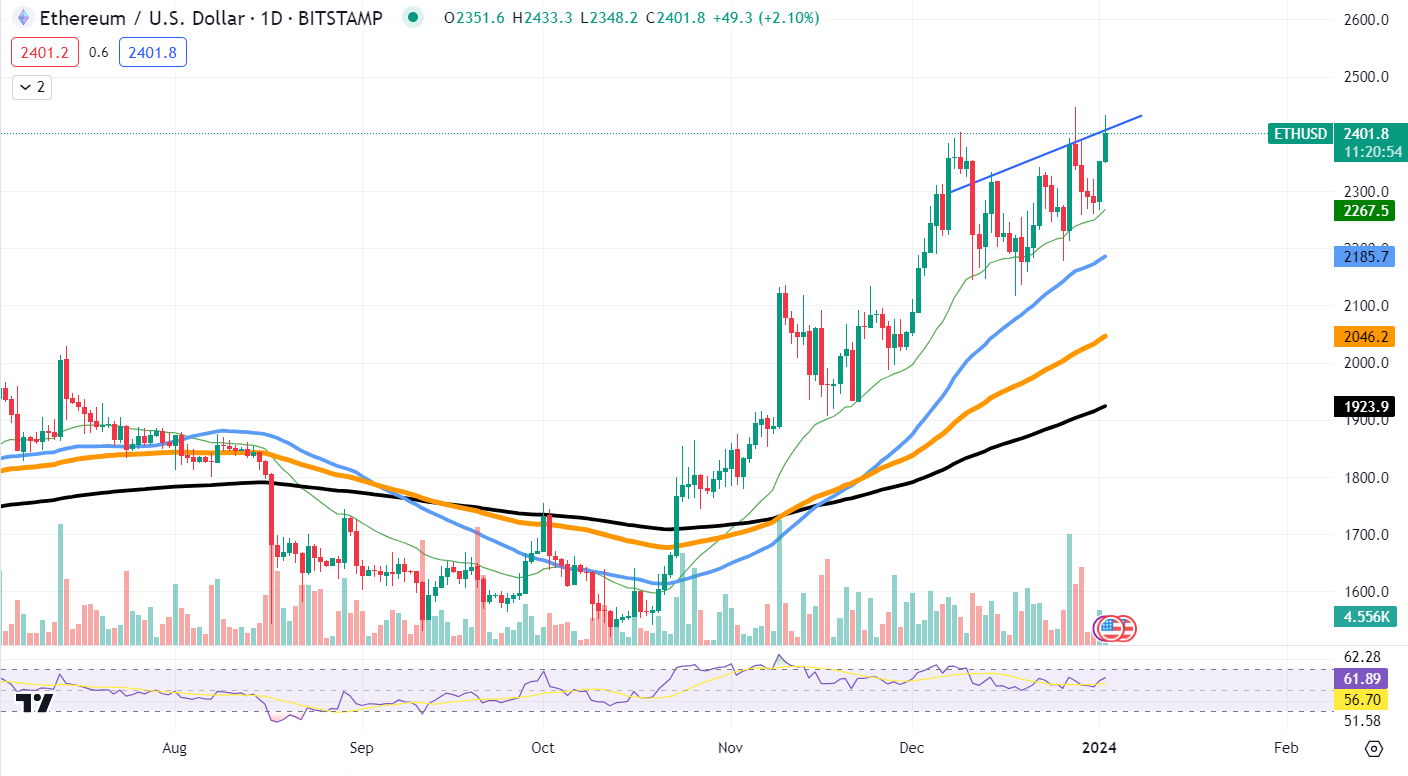
Ethereum (ETH) is making steady progress in the market as it nears a crucial resistance level at $2,400. Breaking through this resistance could potentially propel the asset closer to the $2,500 mark, particularly if investors refrain from initiating a sell-off.
The Relative Strength Index (RSI) offers hints that the current trend may continue. With the RSI positioned above the median line but not yet in overbought territory, there appears to be more room for upward movement before the asset becomes overextended.

ETH/USD Chart by TradingView
Potential Regulatory Decisions Await Ethereum’s Next Move
As Ethereum tests this local resistance, the cryptocurrency community is eagerly awaiting regulatory decisions that could have a significant impact on the broader market. One of the potential catalysts for Ethereum, as well as the wider cryptocurrency market, is the approval of a spot Ethereum Exchange-Traded Fund (ETF) or a Bitcoin spot ETF.
The approval of a spot ETF has been eagerly anticipated within the sector for quite some time. An ETF allows investors to purchase shares representing the value of the underlying asset, in this case, Ethereum, without needing to hold the cryptocurrency itself. This simplifies entry for investors who are interested in the asset class but are hesitant about dealing with the complexities of owning, storing, and securing cryptocurrencies.
Observers in the market are closely monitoring Ethereum’s ability to maintain its upward trajectory and surpass the $2,400 price point. A successful breach of this level could pave the way for further gains, potentially leading to the $2,500 mark.
Cardano Breaks New Ground with Recent Breakthrough
Cardano (ADA), often seen as a project that proceeds with caution and lags behind the market, recently experienced a breakthrough that suggests a potentially disruptive performance in the near future.
The chart for Cardano indicates that the price has reached a pivotal point. After a period of consolidation, ADA’s price appears to be making a decisive move. A converging pattern has formed, typically indicating a price breakout. Notably, the price has surpassed the upper trend line of this pattern, signaling a potential continuation of the rally.
Analyzing the moving averages further reveals a bullish setup, with the price trading above both the 50-day and 200-day moving averages. This is often interpreted as a positive signal, reflecting a strong underlying trend with sustained buying interest. The gap between the moving averages and the current price further strengthens this bullish narrative.
Although the volume bars do not indicate a significant increase, it suggests that the breakout may not have fully caught the market’s attention yet. Typically, a rise in trading volume would confirm a breakout, indicating increased conviction among traders.
Solana Shows Signs of Potential Correction in Market Run
Solana (SOL) has gained considerable attention within the cryptocurrency community as it continues to gain traction in the market. However, analysts and investors are closely monitoring its price action for signs of sustainability or a potential reversal. Currently, Solana is exhibiting indications that the tide may be turning, with a critical pattern emerging on its chart.
The price movement of Solana has recently formed what is referred to as a lower high, often considered an initial indicator of a potential correction. This technical pattern occurs when the price peaks at a level lower than the previous high, indicating a decrease in the momentum that has been driving the bull market.
The significance of this lower high is magnified when viewed in the context of Solana’s recent performance. While the overall trajectory has been upward, this development suggests that traders and investors may be growing more cautious, potentially leading to a shift in market sentiment.
Furthermore, the volume, a key factor in confirming trend reversals, seems to have diminished during the formation of the lower high. This may signify a reduction in buying pressure. Additionally, the Relative Strength Index (RSI), while still at a relatively high level, has shown signs of divergence, indicating a weakening in the current trend’s strength.
Analyzing Key Indicators for Solana’s Sustainability
When gauging the sustainability of Solana’s market run, several key indicators come into play. The formation of a lower high on the chart suggests the potential for a correction, which may prompt traders and investors to exercise caution.
Additionally, observing the volume and its correlation with price action is crucial. A significant increase in trading volume would solidify the breakout, confirming market conviction and sustaining the upward trend.
The Relative Strength Index (RSI) should also be closely analyzed for any further signs of divergence. If the RSI continues to weaken, it could indicate a loss of momentum and a potential reversal in the current trend.
Keeping a close eye on these indicators will provide valuable insights into the longevity and stability of Solana’s market performance going forward.
Analyst comment
– Ethereum Approaches Critical Resistance at $2,400: This news can be seen as positive for Ethereum as it suggests that the cryptocurrency is making progress and nearing a crucial resistance level. If it breaks through this resistance, it could potentially lead to further gains and reach the $2,500 mark. The market will closely watch Ethereum’s ability to maintain its upward trajectory.
– Potential Regulatory Decisions Await Ethereum’s Next Move: This news can be seen as neutral for the market. The approval of a spot Ethereum ETF or a Bitcoin spot ETF could have a significant impact on the cryptocurrency market. Investors are eagerly awaiting these regulatory decisions, but the outcome is uncertain. Ethereum’s ability to surpass the $2,400 price point will be closely monitored.
– Cardano Breaks New Ground with Recent Breakthrough: This news can be seen as positive for Cardano as it suggests a potentially disruptive performance in the near future. The price of Cardano has reached a pivotal point, indicating a price breakout. The bullish setup and strong underlying trend further support this positive outlook.
– Solana Shows Signs of Potential Correction in Market Run: This news can be seen as negative for Solana as it suggests a potential reversal of the current trend. The formation of a lower high and diminishing volume indicate a decrease in momentum and caution among traders and investors. The sustainability of Solana’s market run will be closely analyzed, and a correction may be possible.


