Dogecoin Price Analysis: Bullish Pattern Signals Potential 27% Rally
Dogecoin's price shows signs of recovery as a bullish pattern emerges on its daily chart. The asset is at the bottom of the bullish market structure, with the potential to rally 27%. Following the recent market downturn, Dogecoin (DOGE) investors rushed to dump their coins on exchanges. But since the market began recovering, exchange inflows have reduced, setting the stage for a possible bullish rally for the meme coin.
Bullish Reversal Pattern
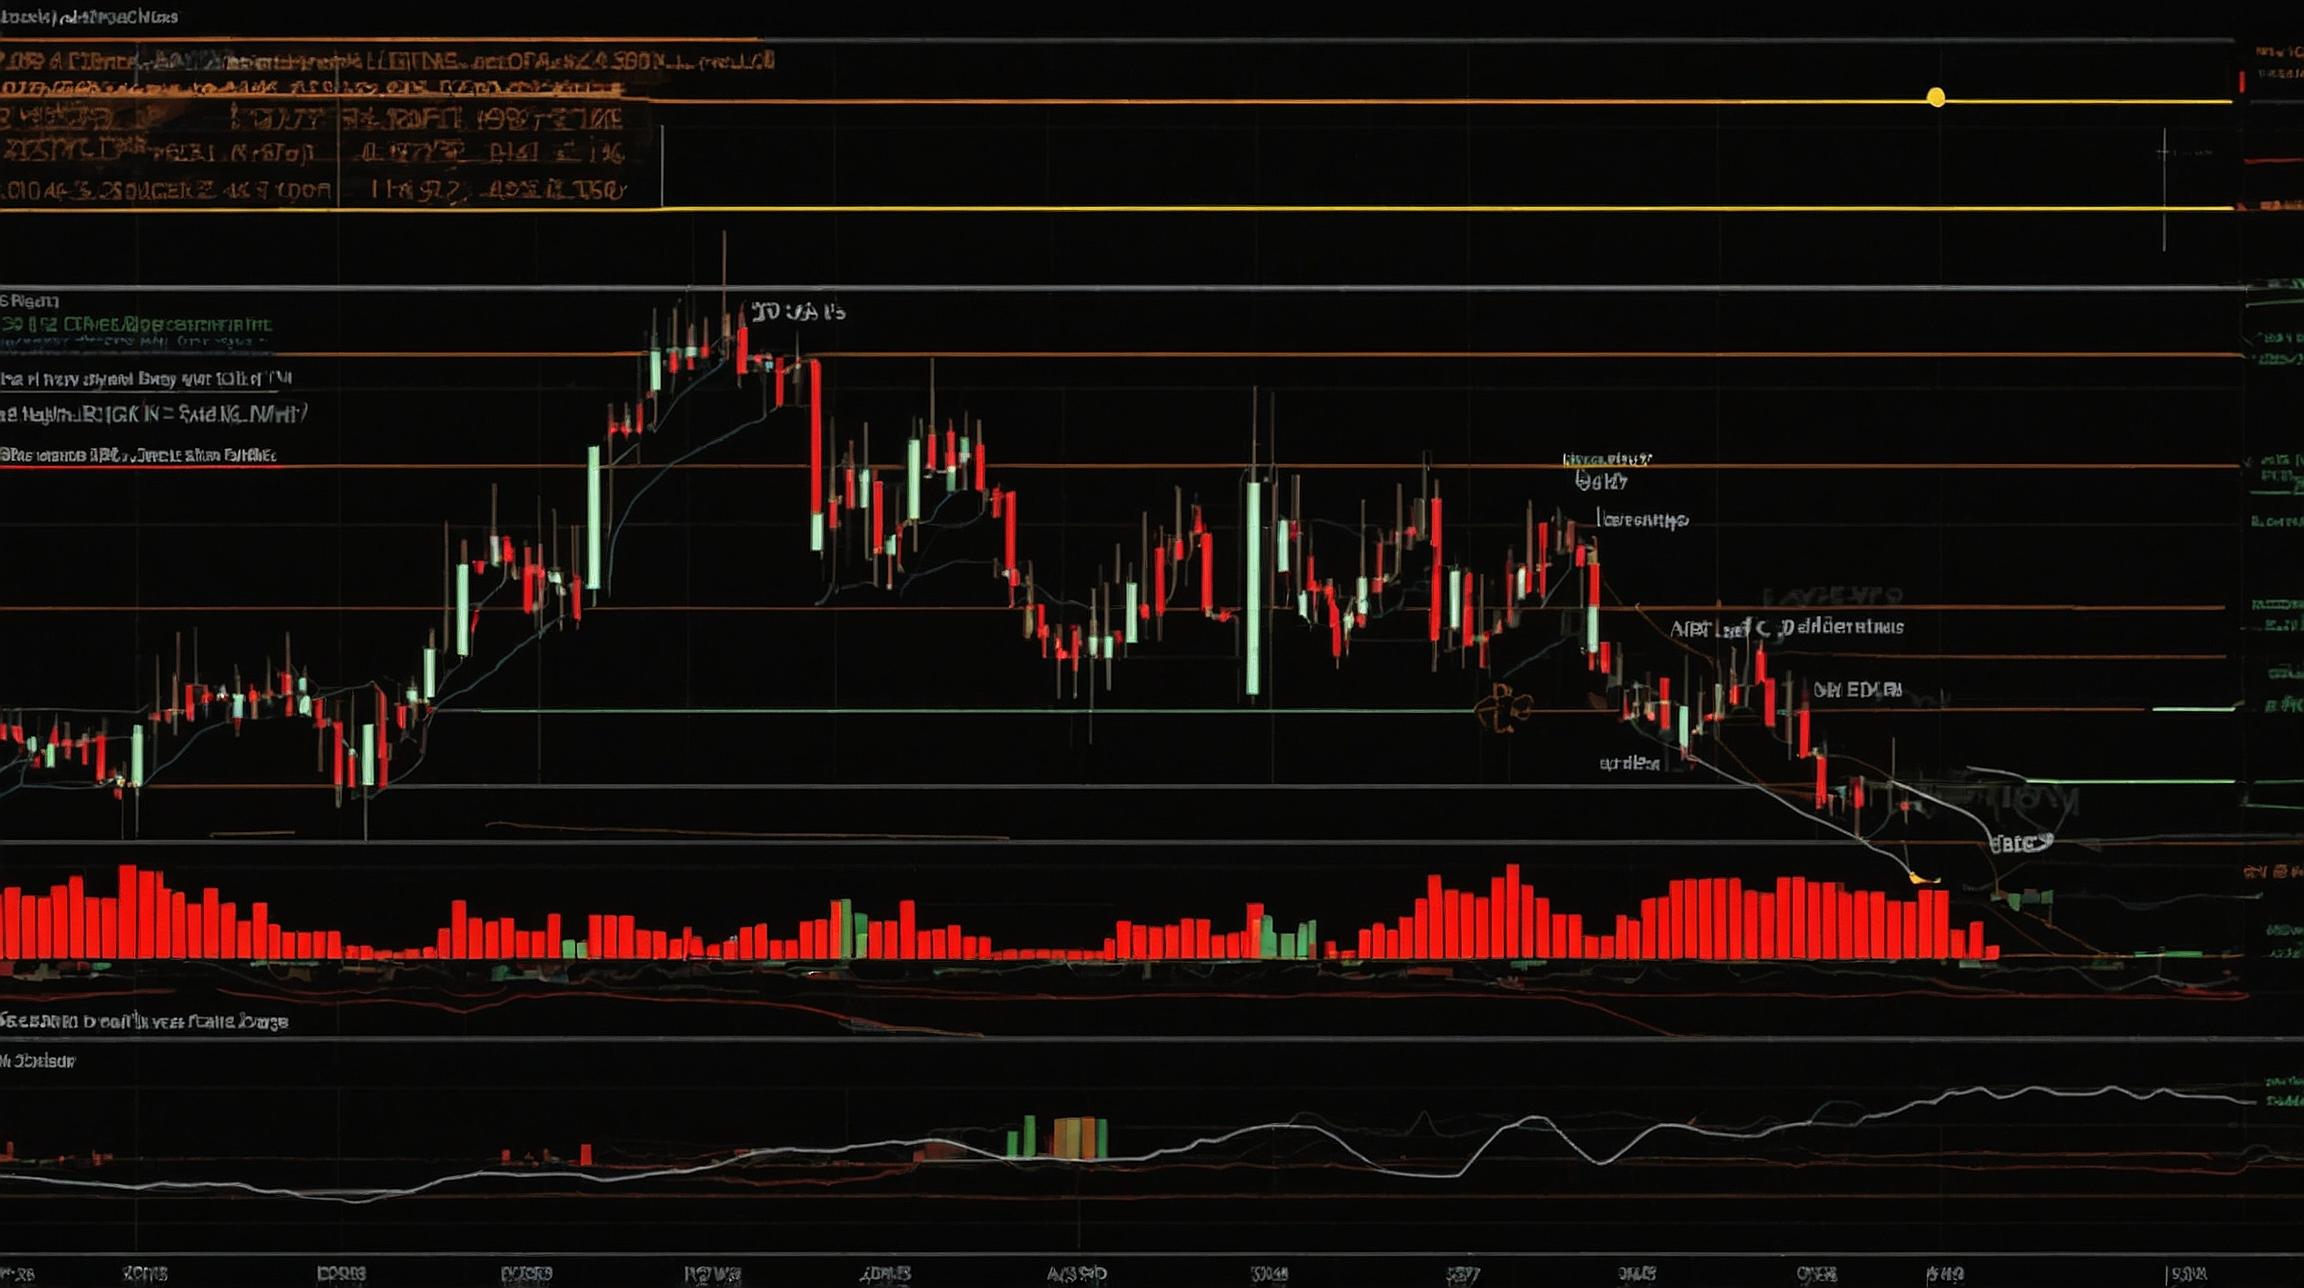
DOGE price is currently downward within a falling wedge pattern, which is typically a bullish reversal pattern. Recent candlestick formations show a strong bounce off the lower boundary of the wedge with significant volume, indicating a potential reversal. The price movement within the falling wedge pattern suggests a corrective wave. However, the recent bounce from the lower boundary could indicate the end of a corrective wave and the beginning of a new impulsive wave.
Key Technical Levels
The 50-day Exponential Moving Average (EMA) at $0.122 and the 200-day EMA at $0.126 are above the current price, reinforcing the bearish trend. The Dogecoin price has immediate support at $0.095, near the recent low. Resistance exists at $0.1053 (the recent high) and at the 50-day EMA ($0.122).
The Relative Strength Index (RSI) is at 32.50, indicating that DOGE is in oversold territory and suggesting a potential price bounce. The Chaikin Money Flow (CMF) is at -0.03, showing mild selling pressure but not overly strong.
Potential Price Targets
If the price rallies and breaks above the falling wedge, it will bullish DOGE’s value in the long term, setting new price targets around $0.14, $0.17, and $0.21.
Overall, the falling wedge pattern suggests a potential reversal, especially with the increased volume and RSI in oversold levels. There are opportunities to long in the short term. However, long-term traders may want to wait for confirmation of a trend reversal.
Market Sentiment and Activity
Data shows Dogecoin investors withdrawing their funds from exchanges. Exchange inflows dropped by 38.85% from $664.48 million to $426.24 million over the last day. This follows a peak in exchange inflows, the highest in the last month, stimulated by the recent market crash.
Additionally, Dogecoin open interest slightly increased by 0.09%, signaling a recent rise in market activity. Coupled with the rising price, this may indicate the onset of rising buying pressure for the meme coin.
The anticipated 27% price rise will protect over 451,000 DOGE holders from running losses. According to data, 451,560 holders bought Dogecoin between $0.10 and $0.14.
Potential Catalysts
Recent developments in “Payments” integration on X (formerly Twitter) may serve as a catalyst to push the Dogecoin price over the edge and into the breakout zone. If the market conditions reverse and become overly bearish, Dogecoin exchange inflows may resume, which could signal market panic, and subsequently turn out bearish for the asset’s price.
Frequently Asked Questions (FAQs)
What is the current pattern for Dogecoin?
Dogecoin is currently within a falling wedge pattern, which is typically a bullish reversal pattern. The asset shows signs of potential recovery, with a possible 27% rally from its current levels.
What does the falling wedge pattern indicate?
The falling wedge pattern suggests a potential reversal from the current bearish trend to a bullish one. If the price breaks above the wedge, it could set new price targets of $0.14, $0.17, and $0.21.
What should long-term traders consider?
Long-term traders may want to wait for a confirmed trend reversal before making significant investments. If the price breaks out of the falling wedge pattern, it could mark the beginning of a sustained bullish trend.


