## **Bitcoin Price Facing Challenges Amid Miner and Whale Sell-Offs**

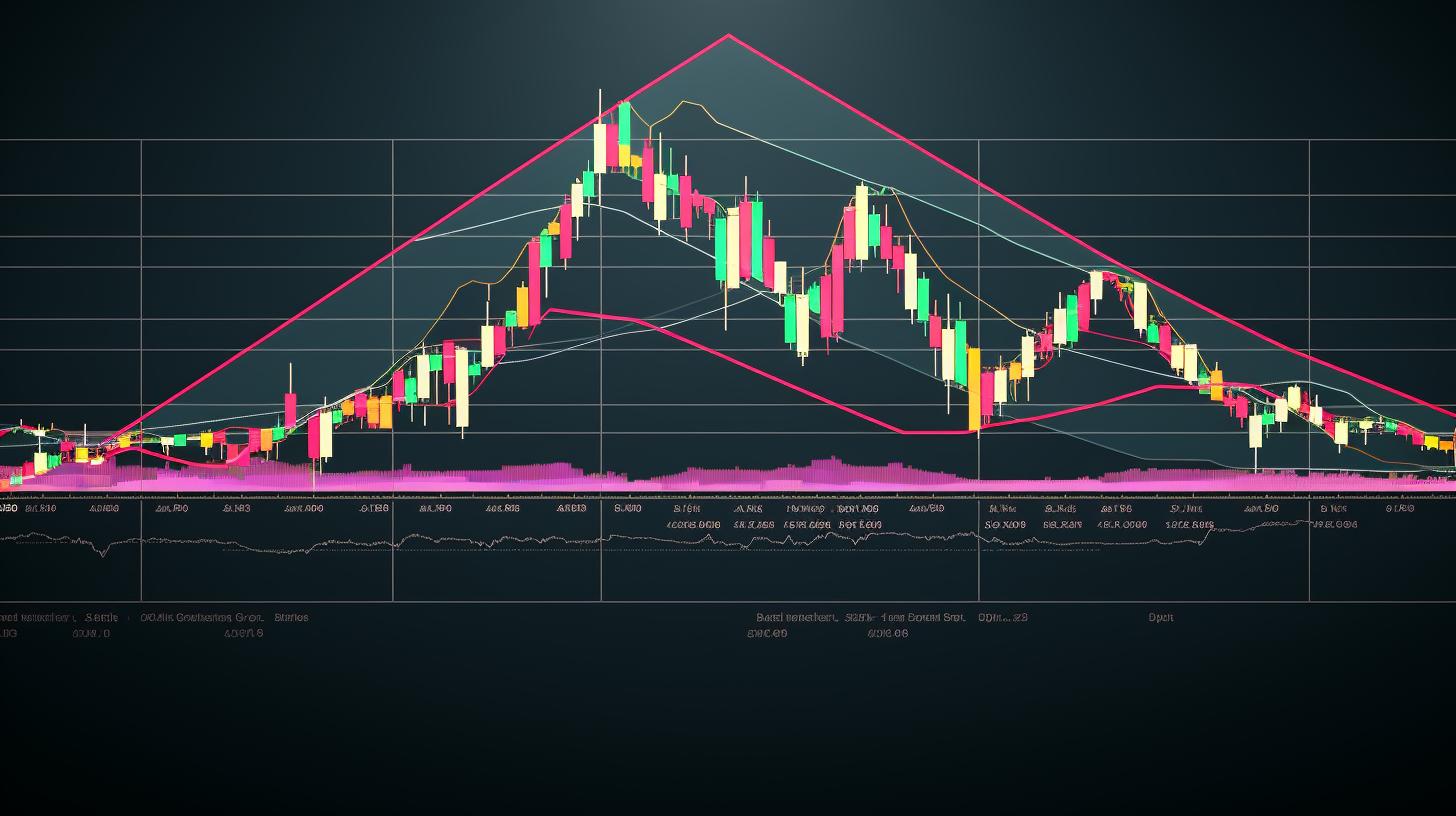
The **Bitcoin price** has experienced **aggressive selling pressure** over the past week, resulting in a notable decline from **$71,947** to **$66,197**. The 8.3% pullback appears to be driven by multiple factors including pre-CPI data uncertainty, significant outflows from **BTC ETFs**, whale distributions, and **Bitcoin miners’ capitulation**. During this downturn, Bitcoin's price formed a **bearish reversal pattern**, *indicating a potential downtrend continuation*.

### **Bitcoin's Current Market Movement**

Despite its recent struggles, **Bitcoin** remains the *leading digital asset*, but it has been trading sideways for the past three months, pausing from its uptrend. This consolidation formed a **bullish flag**, an optimistic chart pattern typical in strong uptrends which stabilize the asset before continuing upward. However, on June 7th, a bearish reversal from the overhead trendline pushed Bitcoin to a new 4-week low of **$64,936** and its market cap dropped to **$1.28 trillion**.

### **Contributing Factors to Recent Decline**

The recent correction has been exacerbated by uncertainties surrounding U.S. **CPI** and **PPI data**. Sellers gained momentum as **BTC ETFs** witnessed substantial outflows. **Crypto trader Alicharts** noted that **Bitcoin miners** sold over **1,200 BTC**, valued at over **$79.20 million**, contributing significantly to the price drop. According to data from **CryptoQuant**, miner sell-offs surged starting June 10, 2024, correlating with Bitcoin’s price decline. This suggests miners are struggling with operational costs post-halving.

### **Significant Whale Activity**

Another considerable factor in the price decline is the activity of **Bitcoin whales**. Data from **Santiment** indicates that Bitcoin whales have liquidated over **50,000 BTC** in the past 10 days, amounting to roughly **$3.30 billion**. This large-scale sale has correlated with Bitcoin's price downturn during the same period.

### **Technical Analysis and Future Outlook**

On Friday, sellers breached the combined support of **$66,588** and the **50-day EMA slope**. If this breakdown holds, the **BTC price** could plunge to around **$57,000** by the end of June, seeking support from the lower trendline of the flag pattern. For buyers to regain control, a breakout above the flag pattern would be essential, potentially boosting Bitcoin’s price to **$90,000**.

#### **Technical Indicators**

- **RSI**: The daily Relative Strength Index slope falling below 50% indicates a *bearish near-term trend*.
- **EMAs**: The upswing in the daily **Exponential Moving Averages (100 and 200)** suggests that the broader trend for Bitcoin remains bullish despite near-term volatility.

*[For more in-depth analysis on Bitcoin and cryptocurrencies, stay tuned with Bloomberg's latest updates](https://bloomberg.com).*
Bitcoin Faces Critical Support: $60K or $80K by June End?

John Darbie is a seasoned cryptocurrency analyst and writer with over 10 years of experience in the blockchain and digital assets industry. A graduate of MIT with a degree in Computer Science and Engineering, John specializes in blockchain technology, cryptocurrency markets, and decentralized finance (DeFi). His insights have been featured in leading publications such as CoinDesk, CryptoSlate, and Bitcoin Magazine. John’s articles are renowned for their thorough research, clear explanations, and practical insights, making them a reliable source of information for readers interested in cryptocurrency. He actively follows industry trends and developments, regularly participating in blockchain conferences and webinars. With a strong reputation for expertise, authoritativeness, and trustworthiness, John Darbie continues to provide high-quality content that helps individuals and businesses navigate the evolving world of digital assets.


